Section 1.5
Table of Contents
The Limit
This is section 1.5
The question: #
What happens to the $y$-values of a function as the $x$-values get closer to a particular value?
Limits: An informal definition #
We write $\displaystyle \lim_{x \to a} f(x) = L$ and say “the limit of $f(x)$, as $x$ approaches $a$, is $L$” if we can make the values of $f(x)$ arbitrarily close to $L$ (as close to $L$ as we want) by making the values of $x$ sufficiently close to $a$ but not equal to $a$.
i.e. “You want this part machined within 0.001mm error tolerance (y-values)? I can adjust my tools (x-values) to do that!”
Example #
Guess the value of $\displaystyle \lim_{x\to 1} \frac{x-1}{x^2 -1}$
note: you can’t just plug in $1$ because that function isn’t defined there.
Example #
Take a moment guess the value of $\displaystyle \lim_{x\to 0} \dfrac{\sin x}{x}$.
Note: In calculus, we’re nearly always using radians, so these $x$ values are radians. If you’re using Google Sheets, the =SIN function automatically uses radians. If you’re using a calculator (or another tool) make sure you’re in radian mode.
Click to reveal the answer.
Did you guess 0? You're right!One-sided limits #
Definition: #
We write $$ \lim_{x\to a^-} f(x) = L $$ and say the limit of $f(x)$ as $x$ approaches $a$ from the left is equal to $L$ if we can make the values of $f(x)$ arbitrarily close to $L$ (as close to $L$ as we want) by making the values of $x$ sufficiently close to $a$ but not equal to $a$.
Similarly, we define $$ \lim_{x\to a^+} f(x) = L $$ to be the right-hand limit.
Connection to total limit #
We say that: $$ \lim_{x \to a} f(x) = L \text{ if and only if } \lim_{x\to a^-} f(x) = L \text{ and } \lim_{x\to a^+} f(x) = L $$
Some visual examples #
Here’s a Geogebra applet that demonstrates visually different one-sided and two-sided limits compared to the total limit. Click ‘animate’ next to each limit and watch as the $y$-values as the $x$-values get close to the desired number.
Be sure to adjust the slider that says Example = # because that shows three different limit examples.
https://www.geogebra.org/m/AKbRXpJJ
Note that, from the Geogebra applet:
- On example 1, the left and write limits are the same, so $\lim_{x\to -3} f(x) = 3$, even though the function’s value is -1 there, and
- On example 3, because the left and right limits aren’t the same, we say $\lim_{x\to 2} f(x)$ does not exist and often write DNE.
Infinite Limits #
Example #
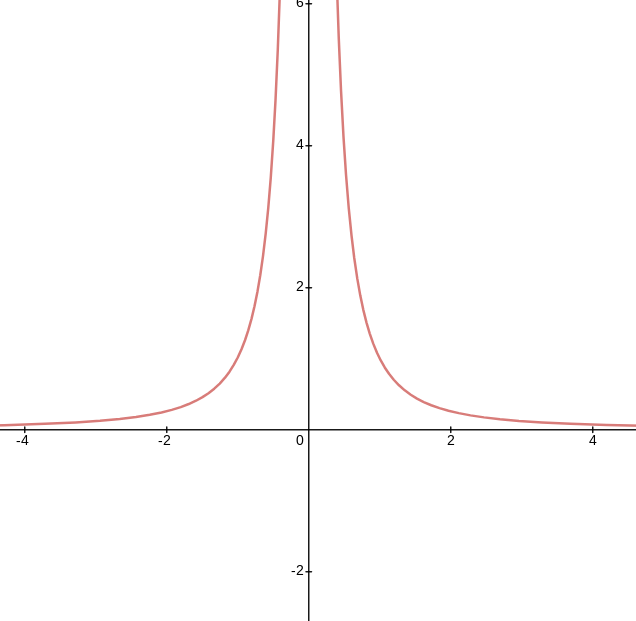
Consider $\displaystyle \lim_{x\to 0} \frac1{x^2}$.
That graph obviously looks like this:

Looking at the left and right limits, we have:
$\lim_{x\to 0^-} \frac{1}{x^2} = \infty$ and $\lim_{x\to 0^+} \frac{1}{x^2} = \infty$
Because both sides tend to the same value, we say that limit $\displaystyle \lim_{x\to \infty} \frac{1}{x^2} = \infty$. The limit does not exist and $\infty$ is not a number, but because the left and right limits agree on the same value, we write the special value this way.
Compare to the next example
Example #
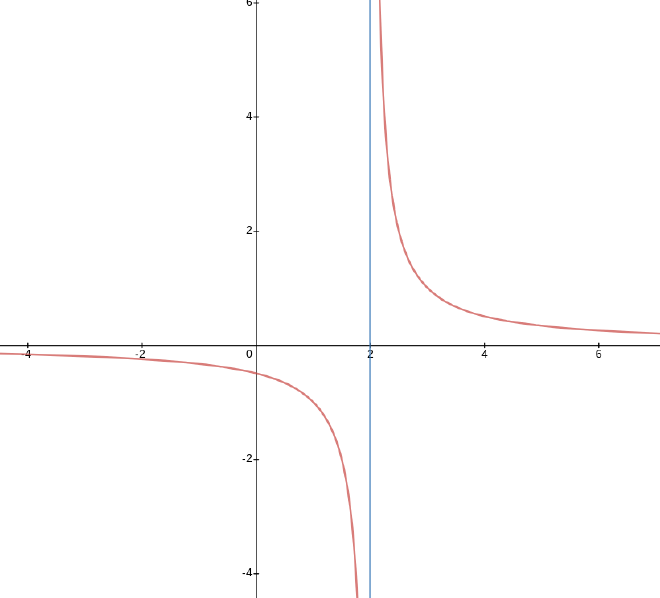
Consider the limit $\displaystyle \lim_{x\to 2} \dfrac{1}{x - 2}$.
The graph is this one:

This time, my one-sided limits are as follows:
$\displaystyle \lim_{x\to 2^-} \frac{1}{x-2} = -\infty$ while $\displaystyle \lim_{x\to 2^+} \frac{1}{x-2} = \infty$.
… in this case, the limits don’t agree, so we still say that the limit doesn’t exist but we write $\displaystyle \lim_{x\to 2} \frac{1}{x-2} = \text{DNE}$.
Visually exploring vertical asymptotes #
If you want to play with another geogebra applet, this one explores vertical asymptotes as limits. Here, you’ll click the points and move them left and right. Watch as the x-values get close to the location of the asymptote and see the y-values head up to infinity or down to negative infinity. These are infinite limits from the left and right!
https://www.geogebra.org/m/PSrua4JF
Now practice! #
Head over to WebAssign and work on section 1.5. If you have questions, let me know!