Section 4.1
Table of Contents
Area, Distances, and Approximations
The Area Problem #
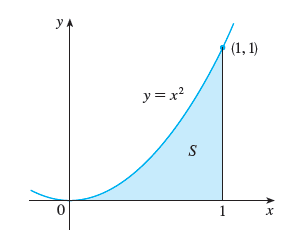
The motivation of this section is that we want to find the area that is under a curve, above the $x$ axis and between two endpoints. For example, consider the shaded region under the curve $f(x)=x^2$ on the interval $[0, 1]$:

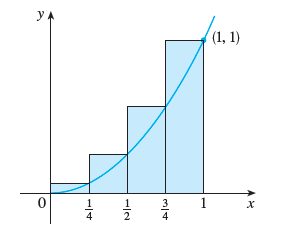
One approach is to approximate the area by cutting the region into rectangles. Let’s cut $[0, 1]$ into four pieces. The width of each rectangle then will be 1/4 and the height determined by the “right endpoint” as pictured here:

-
The first rectangle’s right endpoint is at $x=1/4$, so its height is $f(1/4) = 1/16$
-
The second rectangle’s right endpoint is $x = 1/2$, so its height it $f(1/2) = 1/4$
-
The third rectangle’s right endpoint is $x = 3/4$, so its height it $f(3/4) = 9/16$
-
The fourth rectangle’s right endpoint is $x = 1$, so its height it $f(1) = 1$
so we can over approximate the area to be = $\frac{1}{16} \cdot \frac14 + \frac14 \cdot \frac14 + \frac{9}{16}\cdot \frac14 + 1 \cdot14 = \frac{15}{32}$ or 0.46875. to get its decimal value1.
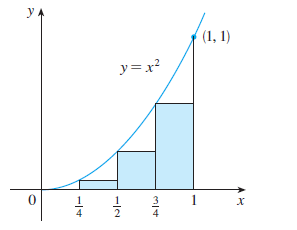
… but that’s an over approximation. Let’s use left endpoints to under approximate to give us a range:

- The first rectangle’s right endpoint is $x = 0$, so its height it $f(0) = 0$ The area is $(1/4) \cdot 0$
- The second rectangle’s right endpoint is at $x=1/4$, so its height is $f(1/4) = 1/16$ The area is $(1/4) \cdot 1/16$
- The third rectangle’s right endpoint is $x = 1/2$, so its height it $f(1/2) = 1/4$ The area is $(1/4) \cdot 1/4$
- The fourth rectangle’s right endpoint is $x = 3/4$, so its height it $f(3/4) = 9/16$ The area is $(1/4) \cdot 9/16$
so we approximate the area by $0 \cdot \frac14 + \frac{1}{16} \cdot \frac14 + \frac14 \cdot \frac14 + \frac{9}{16}\cdot \frac14 = \frac{7}{32}$ or 0.21875.
So, we can say $$ 0.21875 \lt \text{ area under } x^2 \lt 0.46875 $$
That’s a pretty crappy approximation 2, since we can obviously see massive over counting or undercounting in each graph.
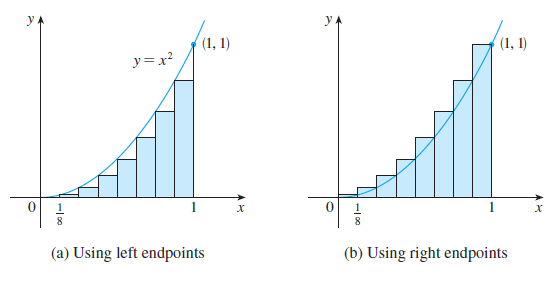
A solution? More rectangles! Let’s try dividing the region into 8 rectangles:

… and we can add even more! Here’s a video demoing going from 5 rectangles to 80 rectangles. Notice how the area values are getting closer and closer together. As though in the limit they will converge to the same number.
Here’s the geogebra activity if you’re curious.
Area as limit of a sum of rectangles #
If $f$ is a continuous function on the interval $[a, b]$, we divide the interval $[a, b]$ into a sequence of $n$ points: $x_1, x_2, x_3, \dots…, x_n$; these are the left or right endpoints of the rectangles. The height of each rectangle will be the value of the function, $f(x_i)$. The width of the rectangle will be $\frac{b-a}{n}$. Then the area under the function $f$ is defined to be $$ \text{Area} = \lim_{n\to \infty} f(x_1) \Delta x + f(x_2) \Delta x + f(x_3) \Delta x + \dots + f(x_n) \Delta x $$
… it’s tedious to write blah + blah + blah + blah + blah … over and over, so mathematicians have a shorthand notation way of writing it, called “sigma notation.” We use $\Sigma$ because that is the Greek letter that makes the for “S” sound in “sum.”
We’ll write: $$ \text{Area} = \lim_{n\to \infty} \sum_{i=1}^\infty f(x_i) \Delta x $$
The $\Sigma$ notation for area is as follows:
$$ \begin{equation*} \sum_{\text{variable and starting point}}^{\text{upper bound}} \text{height * width} \end{equation*} $$
Evaluating areas #
Net Change: Distance, accumulation #
Remember how Distance = Velocity*Time? If we have a velocity function, we’ll use $v(t)$ to be the heights of rectangles, $\Delta t$ to be the widths, and estimate distance by using rectangles!
Example: #
The velocity graph of a braking car is shown. Use it to estimate the distance traveled by the car while the brakes are applied.

Example #
… so yeah, our textbook has the following exercise that definitely made me 😲. It’s about the original SARS outbreak in Singapore in 2003. 3
The shows the number of people per day who died from SARS in Singapore at two-week intervals beginning on March 1, 2003.
| Date | Deaths per day |
|---|---|
| March 1 | 0.0079 |
| March 15 | 0.0638 |
| March 29 | 0.1944 |
| April 12 | 0.4435 |
| April 26 | 0.5620 |
| May 10 | 0.4630 |
| May 24 | 0.2897 |
Estimate the number of people who died of SARS in Singapore between March 1 and May 24, 2003, using both left and right endpoints.
After questioning my answers to myself, I learned that over the course of the roughly four months Singapore was affected, only 33 people died. China and Hong Kong were hit much worse in terms of lives lost.
Source: A. Gumel et al., “Modelling Strategies for Controlling SARS Outbreaks,” Proceedings of the Royal Society of London: Series B 271(2004): 2223–32. via Calculus by James Stewart
Endpoints and approximations #
If you’re given an interval $[a, b]$, then the left endpoints will start with $a$ and not use $b$; and the right endpoints will end on $b$ but not use $a$.
The height will always be the value of the function evaluated at the particular $x$ value.
For approximating the area, you’ll always add together the areas of the individual rectangles which is $f(\text{number}) \Delta x$:
$$ \text{Area} \approx f(x_0) \Delta x + f(x_2) \Delta x + f(x_2) \Delta x \dots + f(x_n) \Delta x $$
We can notice the common factor of $\Delta x$ and factor it out: $$ \text{Area} \approx \Delta x \left( f(x_0) + f(x_2) + f(x_2) \dots + f(x_n)\right) $$
Interpreting the meaning of more integrals #
Integration is usually framed as “area” under a curve, but as we saw above, it’s really always “adding together something times something else.”
Example #
$f(x)$ is the slope of the trail at a distance of $x$ miles from the start of the trail, what does $\int_3^5 f(x)\, dx$ represent?
Hint The ‘rectangles’ we’re multiplying are slope by distance.
Click to reveal the answer.
Since slope of a trail will be $$ f(x) = \dfrac{\text{change in elevation}}{\text{change in horizontal distance}} $$ and our $x$ values range from 3 miles from the start of the trail to 5 miles from the start. The integral will represent the total change in elevation between 3 and 5 miles.Example #
A honeybee population starts with 100 bees and increases at a rate of $n’(t)$ bees per week. What does $100+\int_0^{15} n’(t)\, dt$ represent?
Hint: The ‘rectangles’ are rate of population increase per week multiplied by weeks.
Click to reveal the answer.
This will be the total population of bees after 15 weeks. The integral is the total change in population, but since we're adding 100, the initial population, this gives us the total population.Example #
If $w’(t)$ is the rate of growth of a child in pounds per year, what does $\int_5^{10} w’(t)\, dt$ represent?
Click to reveal the answer.
The change in the child's weight (in pounds) between the ages of 5 and 10.-
This is an exact decimal value. In fact, the only fractions which have exact decimal values are those whose denominators have only factors of 2 and 5. Can you explain why? ↩︎
-
… as opposed to being a crappie approximation, which is a fish. ↩︎
-
When I said this to my wife, she replied “too soon! too soon!” ↩︎